pheb.gif

Soft Robot: Simulating Ocean Wave Movement

Soft Robot: Simulating Ocean Wave Movement

Simulating Ocean Wave Movement in a Soft Pneumatic Surface

Natural patterns can have a restorative effect such as improving our ability to concentrate, facilitated through exposure to pleasing stimuli that intrigues us enough to capture us through a soft fascination, but does not require our direct attention. Our aim is to translate soothing ocean phenomenon into the behavior of our soft robotic surface. Our larger goal is to try to evoke the sense of soft fascination provided by nature through bio-informed cyber-physical systems. We used data from a real ocean wave movement to create a mathematical model which is translated into a tangible form through the inflation patterns of the pneumatic surface.


To characterize ocean wave movement through a mathematical model, we first analyzed real, deep ocean wave data in both the time and frequency domain. Utilizing data from The Coastal Data Information Program which publishes real time ocean data from different buoy locations, we plotted the time series as well as the corresponding frequency spectrum of a few chosen data sets.

An ocean wave can be interpreted as an infinite number of simple harmonic waves of different amplitudes, frequencies, and directions of propagation. In terms of a 2D wave, this can be:

One of the most apparent obstacles was our limited number of pressure regulators and, therefore, a limited number of degrees of freedom. This was accounted for when developing our mathematical model, creating a sum of simple harmonics made of standing waves rather than traveling waves.

We focused on the two pressure regulator assignment configurations.

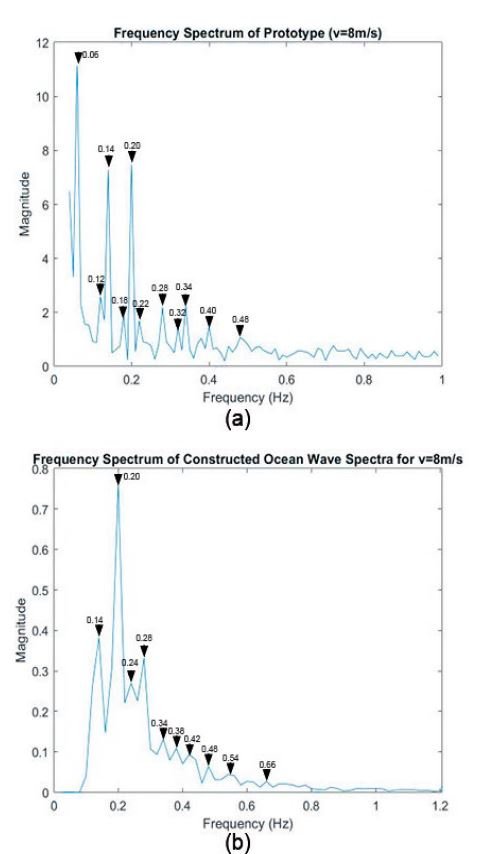
In our experimental validation, we analyzed the resulting movement of the surface from these two types of approaches, first looking at the inflation patterns created and then collecting the frequency spectrum of the surface. We captured moments during testing and compared the inflation patterns with the predicted simulation.

To calculate the resulting frequency of the surface, we took a video of the prototype set at eye level which captured the surface at a rate of 30 frames per second. This was used to compare the resulting frequencies of the surface with the intended frequency spectrum of the finite sum approximation applied in the Arduino code. From the resulting frequency spectra shown, we observed that the prototype’s frequency spectrum successfully shared the same general trend and shape as our mathematical model.